Learn how to use AI to assist you in creating more compelling visuals that drive better decision making for your business partners.
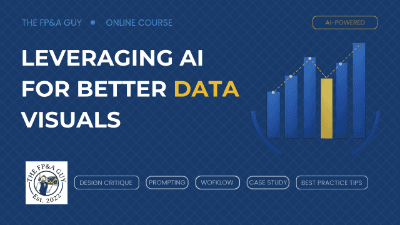
In today's data-driven landscape, the ability to translate complex datasets into clear, impactful visual narratives is a critical skill for business success.
The course "Leveraging AI for Better Data Visuals" is designed to help you incorporate artificial intelligence into the building of your data visuals, teaching you how to utilize LLMs and Excel agents to build more compelling visualizations.
This course focuses on practical applications of AI to assist you in creating more compelling visuals that drive better decision-making. You will explore how artificial intelligence can serve as a powerful design partner. You will learn how to integrate AI into your workflow, build better prompts, receive title and best-practice chart design feedback, and even build charts with AI.
Throughout this learning experience, you will gain the skills necessary to use artificial intelligence to enhance the visuals you create.
Key learning objectives are:
By the end of this course, you will be equipped to use artificial intelligence to enhance the data visualizations you create.

Paul Barnhurst, The FP&A Guy, is a highly respected FP&A (Financial Planning and Analysis) professional, corporate trainer, consultant, and dynamic public speaker. As the founder of www.thefpandaguy.com, Paul is committed to sharing expert knowledge and resources in the field of finance, helping both individuals and organizations enhance their financial planning and business strategy capabilities. Paul’s academic credentials include a Master of Science in Information Management and an MBA in Finance. He also holds the prestigious FPAC (Financial Planning & Analysis Certified Professional) certification from AFP, and the FPAP (Financial Planning and Analysis Professional) from CFI and is recognized as an Advanced Finance Modeler (AFM) by the Financial Modeling Institute (FMI). These qualifications reflect his dedication to mastering the technical and strategic elements of financial planning. In addition, Paul has earned the elite distinction of Microsoft MVP for his excellence with Microsoft Excel, demonstrating his ability to harness and teach the advanced capabilities of the software, a key tool in the FP&A profession. As a recognized thought leader in the FP&A community, Paul regularly engages with his audience of over 100,000 LinkedIn followers, providing valuable insights, best practices, and tools to optimize financial processes. Paul has over a decade of hands-on experience in financial analysis, forecasting, budgeting, and business strategy. His real-world expertise and approachable teaching style have made him a sought-after trainer and mentor, helping professionals at all stages of their careers develop the skills needed to succeed in today’s fast-paced business environment. He is also the host of three popular finance podcasts that discuss FP&A, financial modeling, and the future of finance as it relates to finance and technology.
This portal is provided as a training and development resource for City of Markham employees. Every course is delivered by a qualified subject matter expert or learning organization, is quantifiable in hours, and is verifiable — you receive a documented certificate of completion for every course you finish, stored on LearnFormula indefinitely.
If you hold a professional designation (for example in engineering, accounting, human resources, or law), courses may be counted as professionally relevant, verifiable learning activities toward your continuing professional development. Individual practitioners are responsible for confirming that an activity meets the requirements of their professional body. For questions about the City of Markham's training and development policies, please speak with your people leader or Human Resources.
