Learn how to create charts in Excel to communicate important trends in data to executives and stakeholders
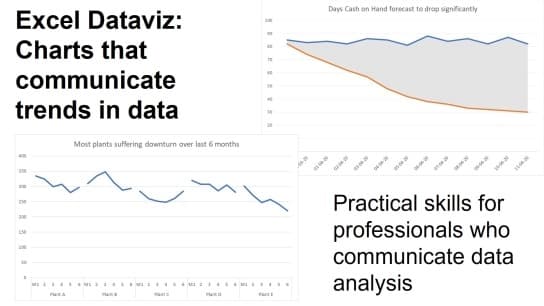
Professionals who have to communicate important trends in data to executives and other stakeholders can improve their presentations and reports by using visuals instead of a table of numbers. This course teaches you practical techniques to choose the correct chart and create basic and advanced charts in Excel to communicate trends.
Field of Study: Computer Software & Applications

Dave Paradi has been recognized by the media and his clients as a presentation expert. He has authored ten books on effective PowerPoint presentations and his ideas have appeared in publications around the world. Dave is one of fewer than ten people in North America recognized by Microsoft with the Most Valuable Professional (MVP) Award for his contributions to the PowerPoint, Excel, and Teams communities. His articles and videos on virtual presenting have been viewed over 3.5 million times and liked over 14,000 times on YouTube. He is a highly rated conference speaker and has delivered more than 500 customized training sessions around the world in the last 23 years.
This portal is provided as a training and development resource for City of Markham employees. Every course is delivered by a qualified subject matter expert or learning organization, is quantifiable in hours, and is verifiable — you receive a documented certificate of completion for every course you finish, stored on LearnFormula indefinitely.
If you hold a professional designation (for example in engineering, accounting, human resources, or law), courses may be counted as professionally relevant, verifiable learning activities toward your continuing professional development. Individual practitioners are responsible for confirming that an activity meets the requirements of their professional body. For questions about the City of Markham's training and development policies, please speak with your people leader or Human Resources.
